
|
Would You Rather Listen to the Lesson?
 |

Once pre-calculus students are confident in their knowledge of functions and relations, they move on to analyzing graphs of functions and relations (including identifying x and y-intercepts, zeros, symmetry, even and odd functions).
Learning how to analyze graphs of functions and relations often comes across as tedious for many students. So one of the biggest difficulties that many math teachers face is how to teach this topic in a way that’s engaging and stimulating for children.
To help out, we’ve created a list of math tips and activities that you can use in your classroom. Use these tips and activities in your classroom and get your students excited about analyzing graphs of functions and relations!

How to Teach Analyzing Graphs of Functions and Relations
Review Functions
First things first – to analyze graphs of functions, students must first have a solid understanding of what functions are. So make sure to briefly review functions. You can provide a definition of functions, as well as domain and range, and go through evaluating functions.
You can also check out our article on teaching functions, which gives you an introduction to functions.
Estimating Function Values From a Function’s Graph
Define what a graph of a function is. You can simply say that the graph of a function is the set of ordered pairs (x, f(x)) in the coordinate plane, where f(x) is the domain of f. Then, you can show students how we can estimate the values of a function by analyzing its graph.
Write a function on the whiteboard and draw its graph on the coordinate plane. For example:
f(x) = |(x-3)² – 2|
f(3) = ?; f(4) = ?
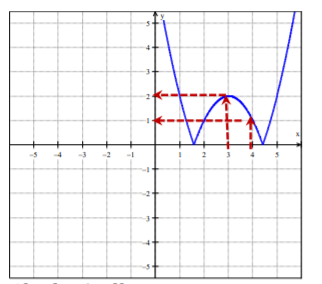
Using a highlighter in a different color can help children visualize the values better, so it’s good to use a highlighter in a different color to show that f(3) = 2 and f(4) = 1.
You can also show students how we can estimate the values algebraically, by plugging in 3 and 4 respectively for the x variable in the above function:
f(x) = |(x-3)² – 2|
=>
f(3) = |(3-3)² – 2| = |0 – 2| = 2
f(4) = |(4-3)² – 2| = |1 – 2| = |-1| = 1
Identifying Intercepts From a Function’s Graph
After having provided a general review of functions and their graphs, you can introduce new terms, such as x and y-intercepts. Define an intercept as the point where the graph intersects the x or y-axis. You can explain that an x-intercept happens at the point where y equals zero, and a y-intercept happens where x equals zero.
For example, you can draw a graph of a function and mark the intercept with a highlighter to illustrate this better. You can write the following function on the whiteboard, and then draw its graph:
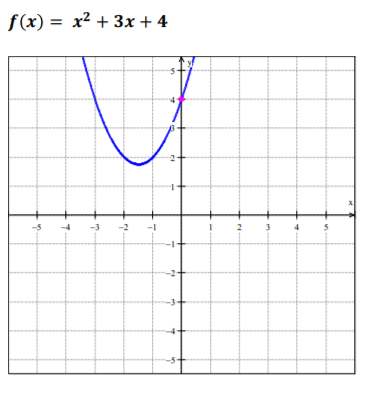
Point out to students that we want to analyze the graph of this function to approximate its y-intercept. Since we know that the y-intercept occurs where x equals 0, we can easily observe that the y-intercept is 4.
You can also demonstrate how we can find the y-intercept algebraically. In simple terms, we’ll start again by the knowledge that the y-intercept is where x = 0, and plug in 0 for the x variable in the function:
f(x) = x²+ 3x + 4
f(0) = 0²+ 3(0) + 4
f(x) = 4

Identifying Zeros of a Function
Point out to children that we can approximate the zeros of a function by analyzing its graph. You can define the zeros of a function f(x) as the x values for which f(x) equals zero. Add that if a graph of a function (f(x) has an x-intercept at (x, 0), x is the zero of this function.
To show students how to approximate the zeros of a function, start by writing a function on the whiteboard and drawing its graph. For example:
f(x) = -x²- 2x
Zeros = ?
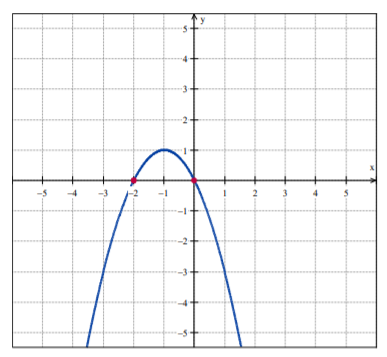
Since we know that the zeros of a function are the x values when f(x) = 0, we need to simply look at the x-intercepts of the graph of the given function to approximate its zeros. In this case, we can observe that the x-intercepts are 0 and -2, so we say that these are the zeros of f(x) = -x²- 2x.
Show students how we can also solve this algebraically. To do so, we need to set f(x) equal to zero. After that, we can solve for the variable x. In other words:
f(x) = -x²- 2x
-x²- 2x = 0
-x(x + 2) = 0
x = 0
Or:
x + 2 = 0
x = -2
Symmetry of Graphs
Explain to students that there are two possible symmetries that graphs can have: line symmetry and point symmetry:
- Line symmetry is when we can fold graphs along a line and the two halves are an exact match
- Point symmetry is when we can rotate graphs 180 degrees with respect to a point and they will look unchanged
Point out that we can perform tests on a graph to check whether it is symmetric by performing simple tests. For instance, if and only, for every point (x, y) on the graph, the point (x, -y) is on the graph, then we say that the function’s graph is symmetric with respect to the x-axis.
In addition, explain the test for symmetry for the y-axis. You can point out that if and only if, for every point (x, y) on the graph, the point (-x, y) is also on the graph, we say that the graph of the function is symmetric with respect to the y-axis.
Finally, if and only if, for every point (x, y) on the graph, the point (-x, -y) is also on the graph – the function’s graph is symmetric with respect to the origin. You can also draw examples of all three tests on the whiteboard to illustrate this visually and support it numerically.
Identify Even and Odd Functions
Explain to children that we can also check whether functions are even, odd, or neither graphically, as well as algebraically. You can define even functions as functions where f(x) = f(-x). In other words, the function is symmetric to the y-axis.
Define odd functions as functions where f(-x) = -f(x). If the function is odd, it’s also symmetric to the origin. Finally, highlight that a function is not necessarily even or odd, it can be neither. If the function doesn’t fulfill the requirements for even or odd functions, we say that it’s neither.
Demonstrate to students how they can determine algebraically whether a function is even, odd or neither. Write a function on the whiteboard, then take – x and plug it in in this function and simplify to check whether f(-x) = f(x); f(-x) = -f(x) or neither.
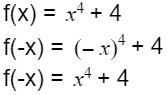
Since we can see that f(-x) = f(x), we can conclude that the function is even. You can also graph this function so that children see that the function is symmetric to the y-axis, that is, everything that the graph does on one side of the y-axis is also reflected on the other side of the y-axis.
Additional Resources
One of the best ways to keep your students engaged is to use all sorts of multimedia materials in your classroom! Just make sure you have a decent internet connection and launch the lesson with the help of a video.
You can start your video lesson by defining a few key terms in advance, such as graphs of a function, domain, and range, x and y-intercepts, zeros of a function, etc. Pause and repeat the video as many times as needed.
For instance, you can use this free and colorful video which contains simple guidelines on finding the domain and range of the function by using the graph of f, identifying intercepts from a functions graph, using the graph of a function to approximate its zeros, as well as analyzing the graph of a function to determine whether the function is even, odd, or neither.
Activities for Practice
Functions’ Graphs Game
To practice analyzing graphs of functions and relations, you can implement a game in your classroom, such as the Functions Graphs Game. You’ll need to prepare task cards in advance and bring a sufficient number of markers.
Each task card contains a math problem related to analyzing graphs of functions, such as identifying the x and y-intercepts, identifying the zeros of a function, etc. You can use our free Assignment Worksheet for inspiration. Divide students into groups of 3 or 4 and provide 3 task cards per group, as well as markers.
Provide the rules of the game. Explain that all members of a given group work together to try to solve the math problems on the task cards. They use the markers to highlight things as instructed in the task cards, such as the intercepts and zeros of functions.
At the end of the class, you can check the work of each group. For every correct answer, a group scores 1 point. For every incorrect answer, the group loses 1 point. In the end, the group with the biggest number of points scored wins the game.
Even or Odd Function?
This is a fun sorting game that will help students improve their skills of identifying whether a function is even, odd, or neither. To implement this game in your classroom, you’ll need to create three boxes per group (one green, one red, and one white), as well as function cards.
Each function card contains one function that is either even, odd, or neither. And each box has a small hole where a card needs to be inserted. Make sure to also prepare and print out your answer sheet for all cards.
Divide students into groups of 3 or 4. Explain to them that you’re going to play a sorting game, and provide the instructions for the game. All group members work together to determine algebraically whether a function card is even, odd, or neither.
Once they have determined this, they place the card in the appropriate box. The even cards are put in the green box, the odd cards in the red box, and the function cards that are neither odd nor even go in the white box.
Give students a few minutes to finish the sorting of the function cards. Once the time is out, you can check the boxes. For each correctly sorted function card, a group earns a point. In the end, the group with the most points is declared the winner of the ‘Even or Odd Function’ game.
Quiz
Quizzes are always a fun and engaging way to review the key concepts of the lesson learned. You can use this quiz activity at the end of the lesson, as an exit quiz. To implement in your classroom, you’ll need to prepare quiz questions on functions and bring a timer.
You can use our free Exit Quiz Worksheet for this purpose, where you’ll find diverse questions related to tests of symmetry, approximating the zeros of a function, determining whether a function is even or odd, etc. Feel free to also add questions.
You can decide to create PowerPoint slides and write each question on a different slide. Create as many slides as needed. Make sure the PowerPoint is visually stimulating to add fun to the activity. Divide students into pairs and provide instructions for the quiz activity.
Each pair takes turns to answer a math question on functions. The question is presented on the slide. Each pair only has two minutes to answer the question before the time beeps (you can increase or decrease the time depending on what you see fit for your class).
If the answer is correct, the pair earns a point, but if the answer is incorrect, they lose 2 points. However, to earn a point, the pair must be able to justify their answer and walk the others through their reasoning. The winner is the pair with the most points earned in the end.

Before You Leave…
If you liked these tips on teaching how to analyze graphs of functions and relations, you may want to have a look at our lesson that’s dedicated to this topic! So make sure to check out our worksheets, guided notes, and activities from our lesson:
- 1-2 Assignment (PDF)
- 1-2 Assignment SE (PDF)
- 1-2 Bell Work (PDF)
- 1-2 Bell Work SE (PDF)
- 1-2 Exit Quiz (PDF)
- 1-2 Exit Quiz SE (PDF)
- 1-2 Guided Notes SE (PDF)
- 1-2 Guided Notes TE (PDF)
- 1-2 Lesson Plan (PDF)
- 1-2 Online Activities (PDF)
- 1-2 Slide Show (PDF)
To get the Editable versions of these files, join us in the Math Teacher Coach community!
- 1-2 Assignment (Doc – Members Only)
- 1-2 Bell Work (Doc – Members Only)
- 1-2 Exit Quiz (Doc – Members Only)
- 1-2 Guided Notes SE (Doc – Members Only)
- 1-2 Guided Notes TE (Doc – Members Only)
- 1-2 Lesson Plan (Doc – Members Only)
- 1-2 Online Activities (Doc – Members Only)
- 1-2 Slide Show (Doc – Members Only)
This article is based on:
Unit 1 – Functions and Relations
- 1-1 Functions
- 1-2 Analyzing Graphs of Functions and Relations
- 1-3 Continuity, End Behavior, and Limits
- 1-4 Extrema and Average Rates of Change
- 1-5 Parent Functions and Transformations
- 1-6 Function Operations and Composition of Functions
- 1-7 Inverse Relations and Functions
Do You Need More Math Resources?
If you need guidance to structure your classes, make sure to sign up for more free resources here! You can also sign up for a membership on MathTeacherCoach or head over to our blog – you’ll find plenty of awesome resources and fun activities!